If you want to know how to read the yield curve, start by looking at how the interest rates on US Treasury securities change as their maturities get longer. If long-term rates are higher than short-term rates, the curve slopes upward and is considered normal; if short-term rates are higher, the curve is inverted, which investors watch as a possible warning about slower growth ahead.
This guide from FMBanksia.com walks through the chart step by step, explains what different shapes may suggest, and covers what the curve cannot tell you.
Key takeaways
- The yield curve plots Treasury yields from short maturities (weeks or months) to long ones (up to 30 years).
- A normal curve slopes upward because lenders usually want extra pay for tying up money longer.
- An inverted curve, with short rates above long rates, has often come before economic slowdowns, but timing is unreliable.
- The curve reflects market expectations about interest rates, inflation and growth, not certainties.
- For most long-term investors, it is useful context rather than a signal to buy or sell.
What the yield curve actually shows
A yield is the annual return a bond pays relative to its price. The yield curve takes the yields on government debt of different lengths and connects them on a single chart. The horizontal axis shows time to maturity, and the vertical axis shows the yield.
In the US, the curve most people mean is built from Treasury securities. The Treasury sells short-term bills, medium-term notes and long-term bonds, and TreasuryDirect describes these terms, from bills lasting a few weeks up to bonds lasting 20 or 30 years.
Where to find the numbers
You do not need a paid terminal to see the curve. The US Treasury publishes daily par yield curve rates for maturities ranging from one month to 30 years.
How to read the yield curve, step by step
Reading the curve comes down to a few simple checks, done in order.
- Find the short end. Look at yields on maturities of a year or less. These tend to track the Federal Reserve’s policy rate closely.
- Find the long end. Look at the 10-year and 30-year yields. These reflect longer-run expectations for inflation, growth and interest rates.
- Compare the two. Is the long end higher, lower or about the same as the short end? That tells you the overall slope.
- Check a common spread. Many analysts subtract the 2-year or 3-month yield from the 10-year yield. A positive number means an upward slope; a negative number means inversion.
- Look at the trend. One day’s curve is a snapshot. Compare it with a few months ago to see whether it is steepening or flattening.
A hypothetical example
Say the 3-month yield is 4.0% and the 10-year yield is 4.5%. The spread is a positive 0.5 percentage points, so the curve slopes upward. Now imagine the 3-month yield is 5.0% while the 10-year is 4.2%. The spread is negative 0.8 points, and the curve is inverted.
These figures are hypothetical, not current rates.
The four main shapes and what they may suggest
Analysts usually group curves into a handful of shapes, each hinting at how bond investors see the road ahead.
| Shape | What it looks like | What it may suggest |
|---|---|---|
| Normal (upward) | Long-term yields higher than short-term yields | Investors expect steady growth and want extra pay for lending longer |
| Steep | A wide gap between short and long yields | Expectations of stronger growth or higher inflation, often early in a recovery |
| Flat | Short and long yields roughly equal | Uncertainty, or a transition between phases of the economic cycle |
| Inverted | Short-term yields higher than long-term yields | Expectations that rates and growth will fall; often watched as a slowdown warning |
Why an inverted curve gets so much attention
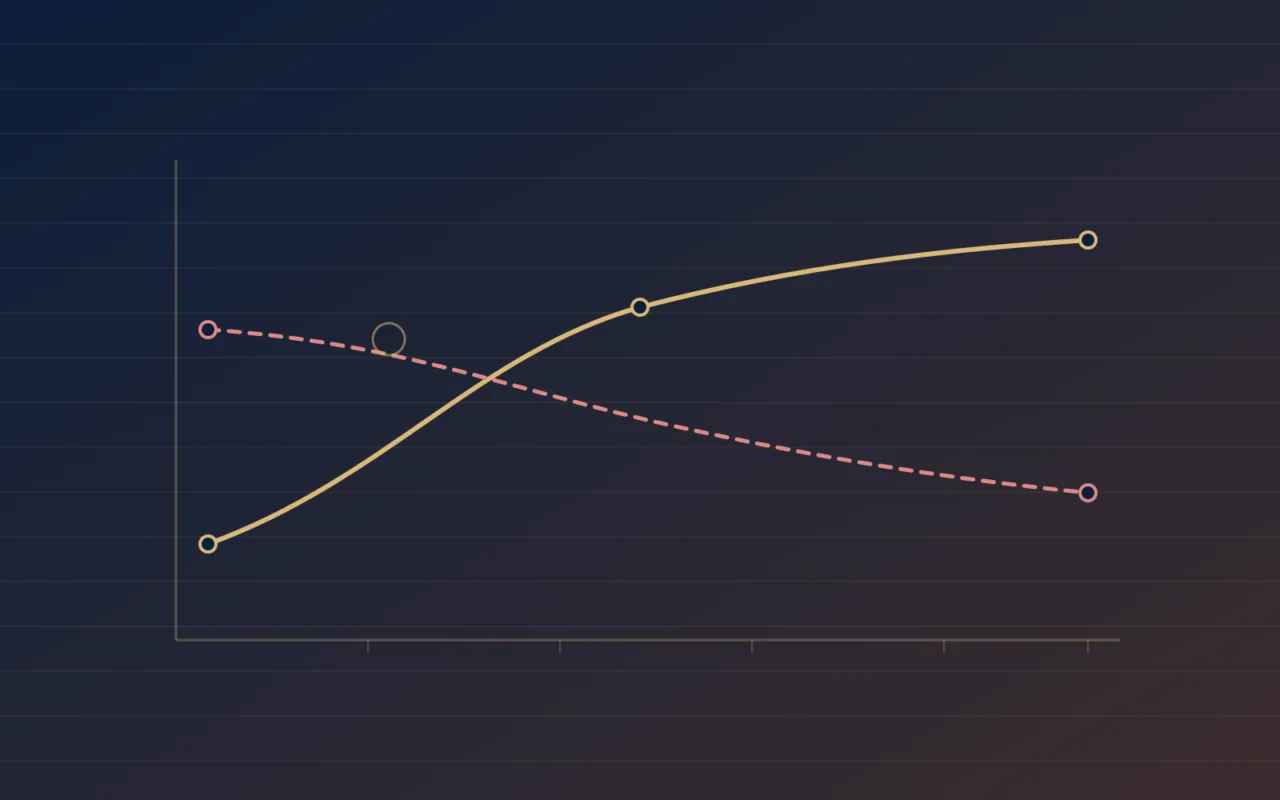
Normally, lenders demand a premium to lock money away for many years. When that premium disappears and short rates climb above long rates, it usually means short-term policy is tight while investors expect rates to come down later.
Investors often expect rates to fall because they anticipate weaker growth. That is why inversions have frequently preceded recessions. Still, the gap between an inversion and any downturn has varied widely, and an inversion is not a guarantee that one will happen.
What the yield curve can and cannot tell you
The curve is a useful summary of market expectations, but it is easy to read too much into it. At FMBanksia.com, we think of it as a weather vane rather than a crystal ball. Keep both sides in mind.
What it can help you understand:
- Where markets expect short-term interest rates to head.
- The general mood about future growth and inflation.
- How restrictive current monetary policy feels relative to the longer run.
What it cannot do is tell you when a slowdown will start, how deep it will be or how stock markets will react. Other forces, such as global demand for Treasuries or changes in how much extra return investors require for long bonds, can also bend the curve.
How the curve touches your everyday money
The curve’s shape filters into the rates you see as a saver and borrower.
Short-term yields tend to influence what banks pay on savings, so when the short end is high, deposit rates often rise too. Our guide to high-yield savings accounts explains how to compare those options. Longer-term yields, especially the 10-year, tend to influence fixed mortgage rates and other long-term loans.
The curve can also affect the value of bonds you already hold. When yields rise, existing bond prices typically fall, and longer bonds usually move more. That is why bond funds can lose value too.
Should you change your investments?
For most people with a long time horizon, the answer is usually no. Trying to time the market around inversions has a poor track record because the lags are long and unpredictable. A diversified plan, such as one built from the funds compared in our index funds vs ETFs explainer, is designed to ride through cycles.
Where the curve can help is in setting expectations. Knowing why headlines say “inversion” can keep you calm instead of reactive. You can find more on long-term strategy in our investing guides.
Putting it in context with other signals
The yield curve works best alongside other information. Currency moves, for example, affect inflation and global demand for US bonds; our piece on what a strong dollar means for you covers that link.
If you want to keep building your understanding of rates and the economy, browse the markets section, or start with the full library of plain-English guides on FMBanksia.com.
Frequently asked questions
What is a normal yield curve?
A normal yield curve slopes upward, meaning longer-term Treasury securities pay higher yields than shorter-term ones. This reflects the extra compensation lenders usually want for tying up money for many years and accepting more uncertainty about inflation and interest rates. It is the most common shape and often appears when the economy is growing steadily.
Does an inverted yield curve mean a recession is coming?
Not necessarily. Inversions have often come before US recessions, which is why they make headlines, but they are not a guarantee. The time between an inversion and any slowdown has varied a great deal, and other factors can distort the curve. Treat an inversion as one warning sign among many, not a firm forecast.
Which yields should I compare when reading the curve?
Two common comparisons are the 10-year yield minus the 2-year yield and the 10-year yield minus the 3-month yield. A positive result suggests an upward slope, while a negative result signals inversion. Looking at the full set of maturities on the Treasury’s daily table gives an even fuller picture of the curve’s shape.
How does the yield curve affect my savings and loans?
Short-term yields tend to influence the rates banks pay on savings accounts and certificates of deposit, while longer-term yields often guide fixed mortgage rates. When the curve shifts, these consumer rates may follow, though not always immediately or by the same amount. Banks and lenders also weigh their own costs and competition when setting rates.
This guide is for general education only and is not personalised financial, tax or legal advice. Consider speaking with a qualified professional about your situation. See our financial disclaimer.